> ## Documentation Index
> Fetch the complete documentation index at: https://datagen.dev/llms.txt
> Use this file to discover all available pages before exploring further.
# Monitor Agent Runs
> View execution logs, tool calls, and agent output
After deploying an agent, you can monitor every execution from the DataGen dashboard or CLI.
## Execution History
Click on any deployed agent to see its execution history. Each run shows:
* **Start time** -- When the execution began
* **Duration** -- How long the run took
* **Status** -- Current state of the execution
* **Trigger** -- What initiated the run (schedule, manual, webhook)
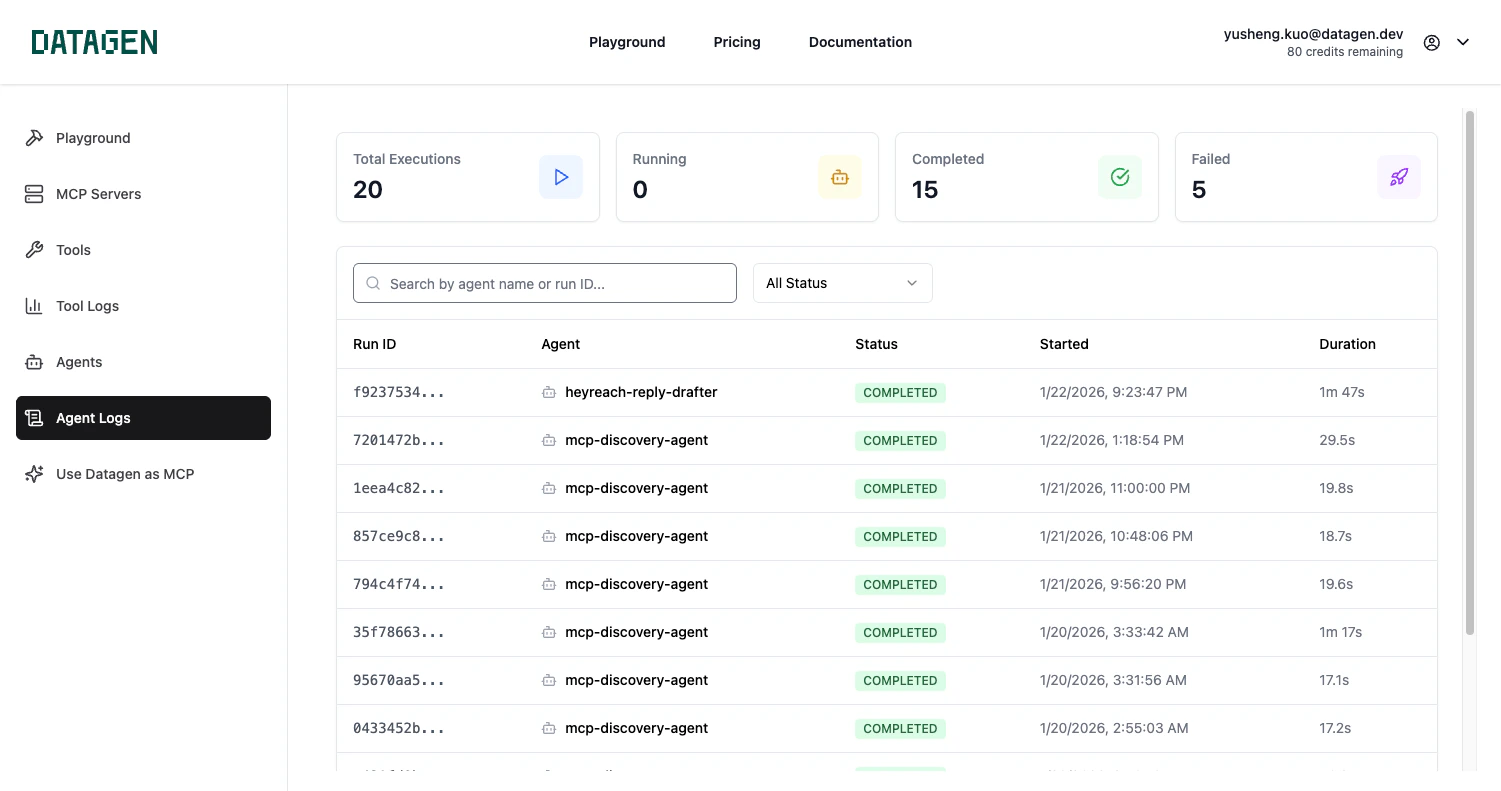 You can filter by status and sort by date.
## Status Types
| Status | Description |
| ------------- | ---------------------------- |
| **Queued** | Run is waiting to start |
| **Running** | Agent is currently executing |
| **Completed** | Run finished successfully |
| **Failed** | Run encountered an error |
| **Cancelled** | Run was manually stopped |
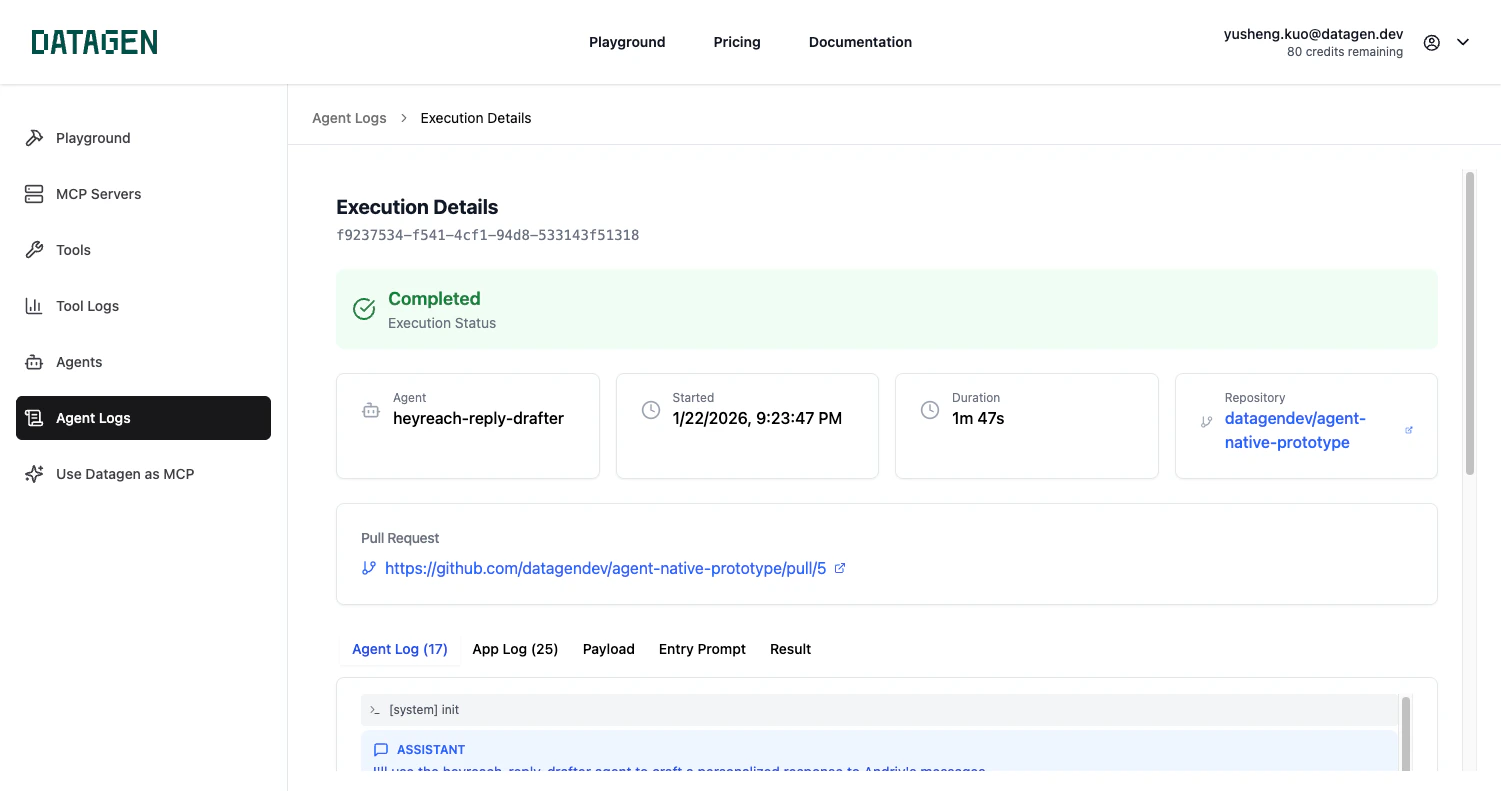
## Execution Details
Click on any execution to see the full details:
* **Event stream** -- Step-by-step log of what the agent did (system events, assistant messages, tool calls, results)
* **Log entries** -- Timestamped messages with levels (DEBUG, INFO, WARN, ERROR)
* **Payload** -- The input payload that triggered the run
* **Result** -- The agent's final output
## Tool Visibility
Each execution log shows which MCP tools your agent called during the run. For every tool call, you can see:
* **Tool name** -- Which MCP tool was invoked (e.g., `mcp_Gmail_gmail_send_email`)
* **Input parameters** -- The exact parameters passed to the tool
* **Output** -- The tool's response data
* **Timing** -- When the tool was called during execution
This helps you debug agent behavior, verify data flow, and understand which integrations your agent is using.
## Viewing Pull Requests
If your agent creates pull requests, a direct link to the PR appears in the execution details.
You can filter by status and sort by date.
## Status Types
| Status | Description |
| ------------- | ---------------------------- |
| **Queued** | Run is waiting to start |
| **Running** | Agent is currently executing |
| **Completed** | Run finished successfully |
| **Failed** | Run encountered an error |
| **Cancelled** | Run was manually stopped |
## Execution Details
Click on any execution to see the full details:
* **Event stream** -- Step-by-step log of what the agent did (system events, assistant messages, tool calls, results)
* **Log entries** -- Timestamped messages with levels (DEBUG, INFO, WARN, ERROR)
* **Payload** -- The input payload that triggered the run
* **Result** -- The agent's final output
## Tool Visibility
Each execution log shows which MCP tools your agent called during the run. For every tool call, you can see:
* **Tool name** -- Which MCP tool was invoked (e.g., `mcp_Gmail_gmail_send_email`)
* **Input parameters** -- The exact parameters passed to the tool
* **Output** -- The tool's response data
* **Timing** -- When the tool was called during execution
This helps you debug agent behavior, verify data flow, and understand which integrations your agent is using.
## Viewing Pull Requests
If your agent creates pull requests, a direct link to the PR appears in the execution details.
 ## Run Now
Test your agent at any time with the **Run Now** button.
## Run Now
Test your agent at any time with the **Run Now** button.
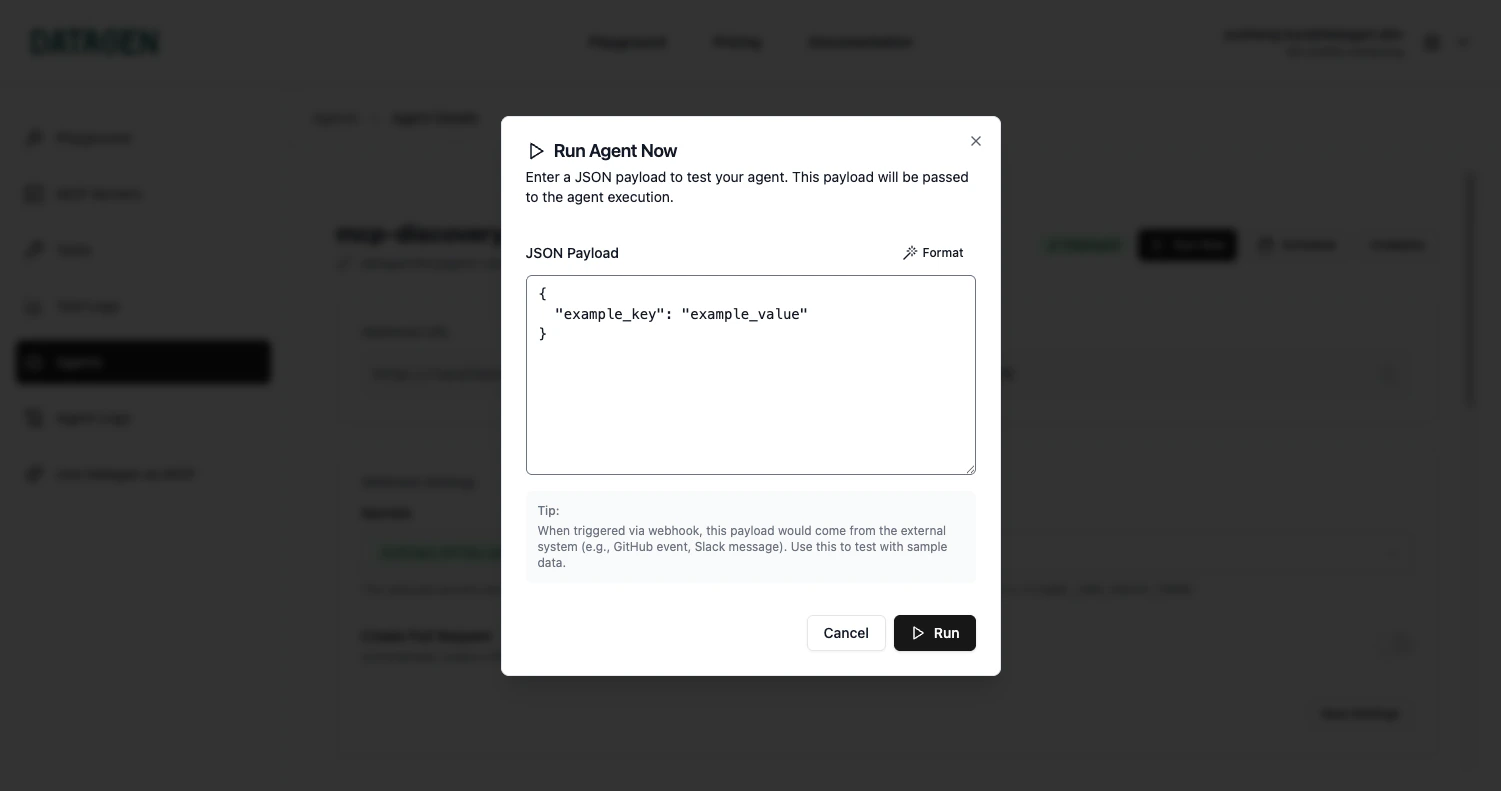 Optionally provide a JSON payload for the test run:
```json theme={null}
{
"task": "Review latest PRs",
"notify": true
}
```
## Monitoring with the CLI
```bash theme={null}
# View execution history
datagen agents logs
# View output of the latest run
datagen agents output
# Stop a running execution
datagen agents run --stop
```
## Next Step
Set up Slack, email, and webhook notifications for your agents
Optionally provide a JSON payload for the test run:
```json theme={null}
{
"task": "Review latest PRs",
"notify": true
}
```
## Monitoring with the CLI
```bash theme={null}
# View execution history
datagen agents logs
# View output of the latest run
datagen agents output
# Stop a running execution
datagen agents run --stop
```
## Next Step
Set up Slack, email, and webhook notifications for your agents