Execution History
Click on any deployed agent to see its execution history. Each run shows:- Start time — When the execution began
- Duration — How long the run took
- Status — Current state of the execution
- Trigger — What initiated the run (schedule, manual, webhook)
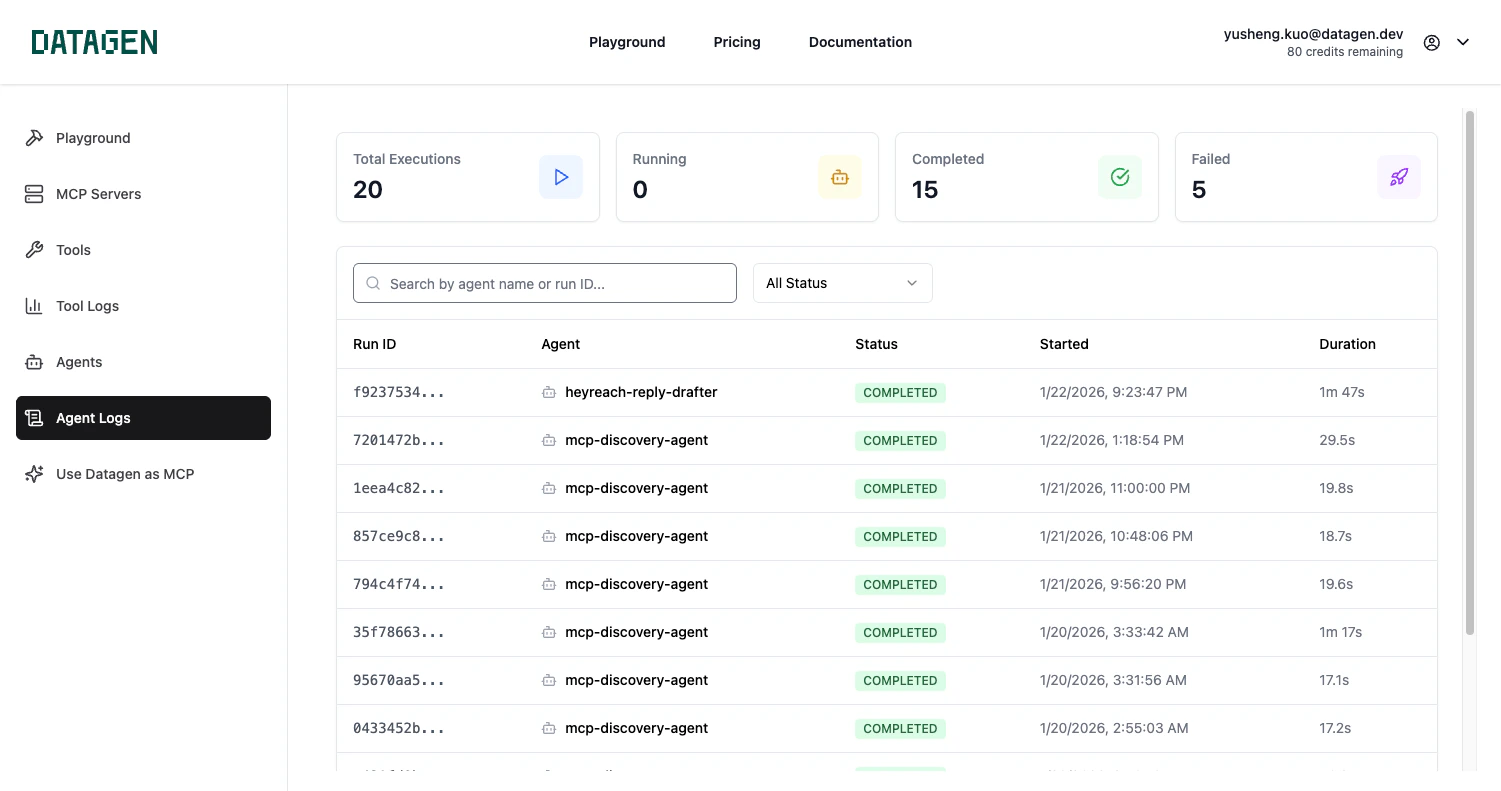
Status Types
| Status | Description |
|---|---|
| Queued | Run is waiting to start |
| Running | Agent is currently executing |
| Completed | Run finished successfully |
| Failed | Run encountered an error |
| Cancelled | Run was manually stopped |
Execution Details
Click on any execution to see the full details:- Event stream — Step-by-step log of what the agent did (system events, assistant messages, tool calls, results)
- Log entries — Timestamped messages with levels (DEBUG, INFO, WARN, ERROR)
- Payload — The input payload that triggered the run
- Result — The agent’s final output
Tool Visibility
Each execution log shows which MCP tools your agent called during the run. For every tool call, you can see:- Tool name — Which MCP tool was invoked (e.g.,
mcp_Gmail_gmail_send_email) - Input parameters — The exact parameters passed to the tool
- Output — The tool’s response data
- Timing — When the tool was called during execution
Viewing Pull Requests
If your agent creates pull requests, a direct link to the PR appears in the execution details.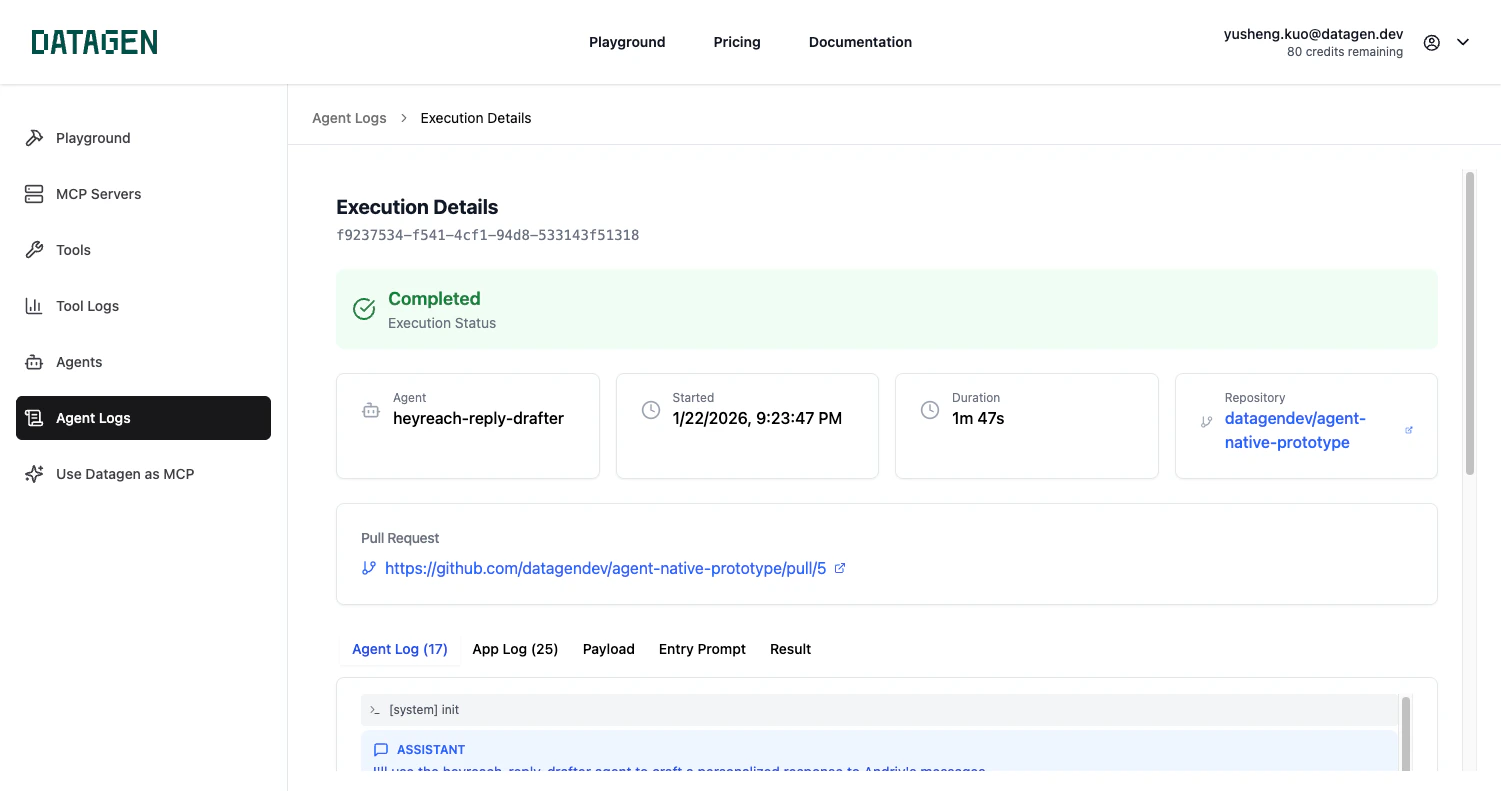
Run Now
Test your agent at any time with the Run Now button.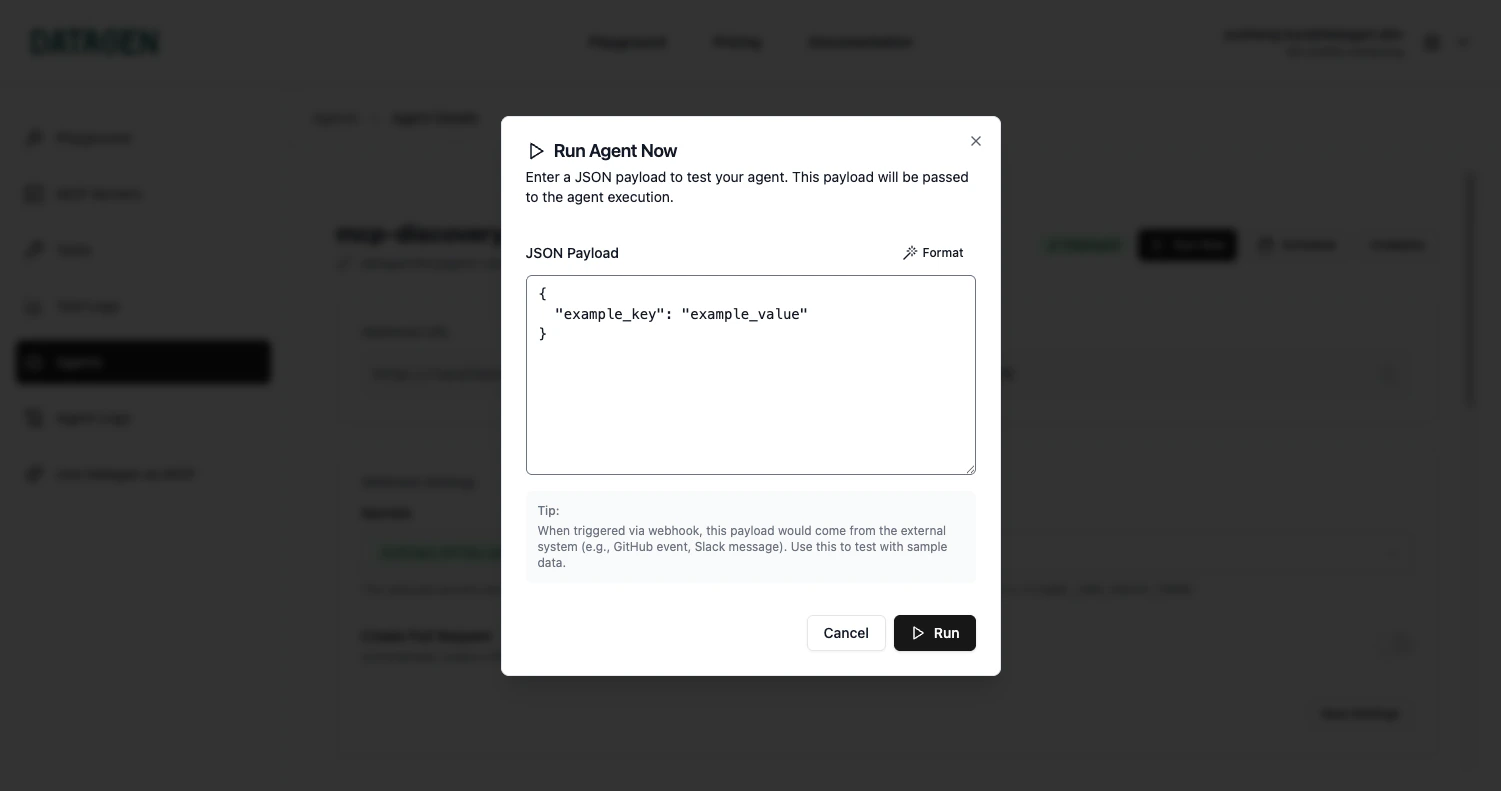
Monitoring with the CLI
Next Step
Channels
Set up Slack, email, and webhook notifications for your agents